|
|
|
|
|
|
|
|
- Overview
- How to use the different types of legends?
- Handling the category labels
- Handling the series labels
- Handling the chart caption
- Handling the chart title
- Handling the title of chart axes
Several types of legends are supported in the charts. The name of these legends differ according to their positions: - Series labelAll the labels of series correspond to the chart legend.
- Category label
- Chart captionThe chart caption can include three elements:
- the labels of categories
- the value of categories
- the percentage of categories
- Chart title
- Title of axes
How to use the different types of legends? Handling the category labels The category labels are displayed: - below the horizontal marks for Line and Stock charts (Candlestick and BarCharts),
- below the X-axis for Column and MinMax charts.
Category labels cannot be used in Scatter charts. The category labels defined with grCategoryLabel can be displayed in the labels of Pie charts ( grShowLabel constant used with grLabel). Special case: the date or date-time category labels
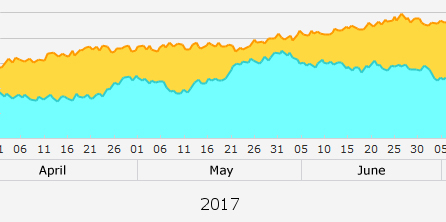
A Chart control can display Date category labels. The option "Scale of X-coordinates spaced out according to time" ("General" tab in the description window of Chart control) is used to get a proper distribution of labels. If the Chart control displays X-coordinates in DateTime format, a zoom performed by the user on the chart will be used to get a time scale with several levels, for each time unit.  The display and presentation of year, months and days is automatic The possible levels are as follows: - Milliseconds,
- Seconds,
- Minutes,
- Hours,
- Days,
- Months,
- Years.
By default: - The minimum level to display is defined according to the range of data.
- The maximum level is defined by using two parameters:
- The maximum number of levels to display in the chart (3 by default).
- The maximum level allowed for the display (by default: year).
The following functions are used to configure the levels displayed:
| | | grTimeLevelMask | Defines the display mask for a level of time scale in a chart. | | grTimeLevelMax | Defines the number of levels to display in the time scale of a chart as well as the maximum level. |
Handling the series labels The set of series labels correspond to the chart legend. Series labels cannot be used in pie charts. grLegend indicates the presence and position of the legend (i.e. all the series labels). Remark: To define series labels in "Scatter" charts, we recommend that you use grScatterSeriesLabel. Handling the chart caption The chart caption can include three elements: - the labels of categories,
- the value of categories,
- the percentage of categories.
Chart captions can only be displayed in Pie, Column and Stacked Column charts. grLabel is used to display the different elements of the chart caption. Different elements are displayed according to the type of chart. The category labels displayed correspond to the ones defined by grCategoryLabel. The value of categories depends on the chart data. The percentage of categories is automatically calculated. The information display can be formatted by grMask. Handling the chart title The chart title can be displayed above or below the chart. The content of the chart title is defined with grTitle. This function can also be used to set the position of the title. The font used for the chart title can be modified by grTitleFont. Handling the title of chart axes The title of chart axes can be displayed for the different axes. The content of the title for the chart axes is defined by grAxisTitle. This function can also be used to position this title according to the desired axis. You cannot define the positioning and/or the orientation of the title in relation to the axis. The font used for the title of the chart axes can be modified by grAxisTitleFont.
This page is also available for…
|
|
|
|
|
|
|
|
|
|
|
|
|
|
|
|
|
|
|
|